Image Details
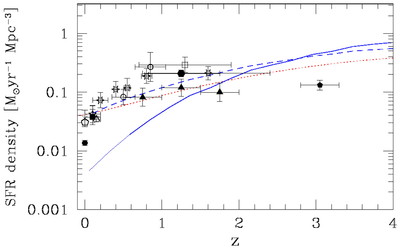
Caption: Fig. 7.
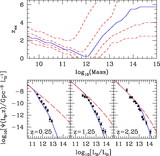
Observed and predicted star formation rate densities. Here the solid and dashed lines represent the ﹩f_{*}=0.1﹩, ﹩f_{*,q}=0.0﹩ and ﹩f_{*}=0.05﹩, ﹩f_{*,q}=0.003﹩ models, respectively, the dotted line shows the fit by Hernquist & Springel (2003), and the points are taken from a wide range of optical, far‐infrared, and 1.4 GHz measurements, as compiled and corrected for reddening by Hopkins et al. (2001) and converted to our assumed cosmology. In particular, the symbols represent measurements by Haarsma et al. (2000; six‐pointed stars), Hopkins et al. (2000; hexagons), Sullivan et al. (2000; five‐pointed stars), Serjeant et al. (2002; open pentagons), Steidel et al. (1999; filled pentagons), Yan et al. (1999; open squares), Treyer et al. (1998; filled squares), Tresse & Maddox (1998; open triangles), Connolly et al. (1997; filled triangles), Rowan‐Robinson et al. (1997; open circles), Gallego et al. (1995; filled circles), and Condon (1989; crosses).
Other Images in This Article
Copyright and Terms & Conditions
© 2004. The American Astronomical Society. All rights reserved. Printed in U.S.A.