Image Details

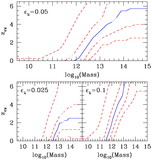
Caption: Fig. 10.
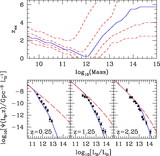
Global impact of quasar outflows on the IGM. Top: Mean number of ﹩S\geq S_{\mathrm{crit}\,}﹩ outflows impacting a random point in space as computed from eq. (19). Here the solid line is given by our fiducial ﹩\epsilon _{k}=0.05﹩ model, while the upper and lower dashed lines correspond to the ﹩\epsilon _{k}=0.10﹩ and 0.025 models, respectively. Center: Compton y‐parameter as computed from eq. (42). The solid and dashed lines are as in the top panel, while the dotted line shows the observational limit of ﹩y\leq 1.5\times 10^{-5}﹩ (Fixen et al. 1996). Bottom: Mass fraction of heated gas in a typical region of circumgalactic gas, associated with the Lyα forest at ﹩z\gtrsim 2﹩ and the WHIM at low redshifts, as computed from eq. (43). Lines are as in the top panel.
Other Images in This Article
Copyright and Terms & Conditions
© 2004. The American Astronomical Society. All rights reserved. Printed in U.S.A.