Image Details
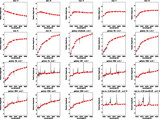
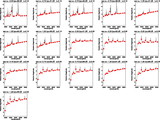
Caption: Fig. 11.
Redshift distribution of the X‐ray associated optical sources (top) and all the galaxy candidates in the T329 field (bottom). The peak at 0.25~0.35 indicates several superclusters along our line of sight at this redshift interval in this field.
Other Images in This Article
Show More
Copyright and Terms & Conditions
© 2004. The American Astronomical Society. All rights reserved. Printed in U.S.A.
Copyright ©
2025 Astronomy Image Explorer. All Rights Reserved.