Image Details
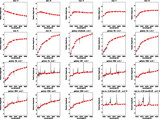
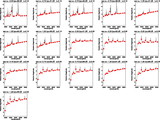
Caption: Fig. 5.
SED plots, as well as the best template fits, shown for all the spatially associated optical sources for 73 of the 75 X‐ray sources. Solid lines: Best‐fitted template SED; squares: BATC PSF photometry SED; crosses: aperture photometry result for the filters is too faint to perform accurate photometry; error bars: photometry errors (see Zhou et al. 2003 for detail). Note that we do not use data that have great uncertainty in the SOCA classification. The best‐fitted χ2 is also listed in for each SED.
Other Images in This Article
Show More
Copyright and Terms & Conditions
© 2004. The American Astronomical Society. All rights reserved. Printed in U.S.A.
Copyright ©
2025 Astronomy Image Explorer. All Rights Reserved.