Image Details
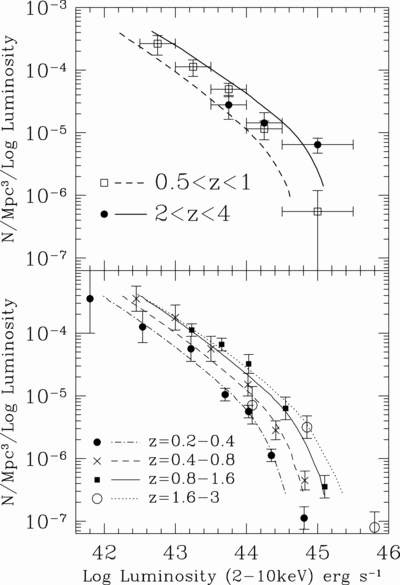
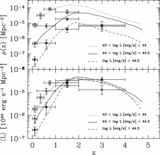
Caption: Fig. 9.
Top: Predicted luminosity functions in the energy range 2–10 keV at low redshifts ﹩0.5< z< 1﹩ (dashed line) and high redshifts ﹩2< z< 4﹩ (solid line) compared with observational values derived from the same sample used in Fiore et al. (2003) to derive the densities in Fig. 8. Bottom: Predicted luminosity functions in the energy range 2–10 keV compared with the observational values obtained by Ueda et al. (2003) at various redshifts.
Other Images in This Article
Copyright and Terms & Conditions
© 2004. The American Astronomical Society. All rights reserved. Printed in U.S.A.
Copyright ©
2025 Astronomy Image Explorer. All Rights Reserved.