Image Details
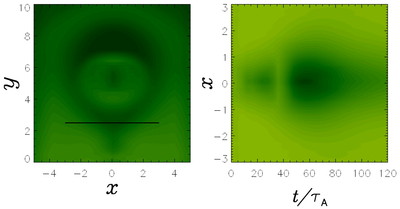
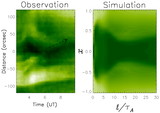
Caption: Fig. 5.
Distribution of the simulated Fe XII 195 Å intensity viewed along a line of sight that is horizontally inclined at ﹩20^{\circ }﹩. Left: One snapshot at ﹩t=60\tau _{\mathrm{A}\,}﹩. Right: Temporal evolution of the intensity along the solid line in the left panel.
Other Images in This Article
Copyright and Terms & Conditions
© 2004. The American Astronomical Society. All rights reserved. Printed in U.S.A.
Copyright ©
2025 Astronomy Image Explorer. All Rights Reserved.