Image Details
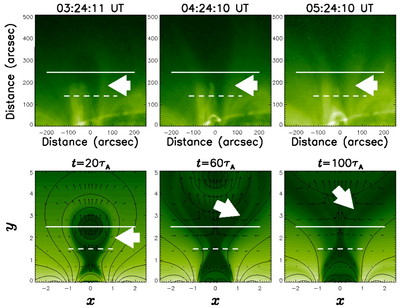
Caption: Fig. 1.
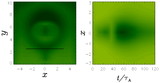
Top: Evolution of the Fe XII 195 Å emission in observations. Bottom: Evolution of the magnetic field (solid lines), velocity (arrows), and Fe XII 195 Å emission intensity (gray scale) in the simulation. Threadlike structures are indicated by white thick arrows in both cases.
Other Images in This Article
Copyright and Terms & Conditions
© 2004. The American Astronomical Society. All rights reserved. Printed in U.S.A.
Copyright ©
2025 Astronomy Image Explorer. All Rights Reserved.