Image Details
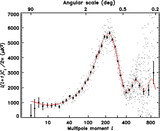
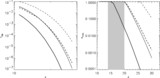
Caption: Fig. 9.
Left: The shaded region in the figure shows the 1 σ contours for the amplitude of the power spectrum as a function of scale for the running spectral index model fit to all data sets. The dotted lines bracket the 2 σ region for this model. The dashed line is the best‐fit power spectrum for the power‐law ΛCDM model. Right: The shaded region in the figure shows the 1 σ contours for the amplitude of the amplitude of mass fluctuations, ﹩\Delta ^{2}( k) =k^{3}P( k) / ( 2\pi ^{2}) ﹩, as a function of scale for the running spectral index model fit to all data sets. The dotted lines bracket the 2 σ region for this model. The dashed line is the best fit for the power‐law ΛCDM model.
Other Images in This Article

Show More
Copyright and Terms & Conditions
© 2003. The American Astronomical Society. All rights reserved. Printed in U.S.A.