Image Details
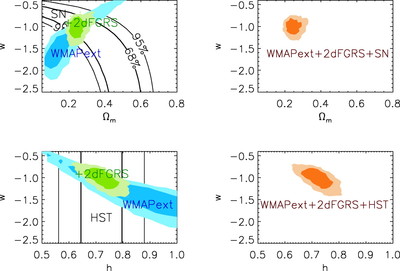
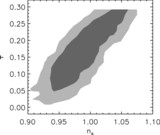
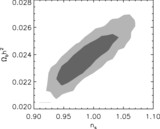
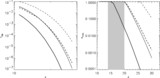
Caption: Fig. 11.
Constraints on dark energy properties. The upper left panel shows the marginalized maximum‐likelihood surface for the WMAPext data alone and for a combination of the WMAPext+2dFGRS data sets. The solid lines in the figure show the 68% and 95% confidence ranges for the fit C supernova data from Perlmutter et al. (1999). In the upper right panel, we multiply the supernova likelihood function by the WMAPext+2dFGRS likelihood functions. The lower left panel shows the maximum‐likelihood surface for h and w for the WMAPext data alone and for the WMAPext+2dFGRS data sets. The solid lines in the figures are the 68% and 95% confidence limits on ﹩H_{0}﹩ from the HST Key Project, where we add the systematic and statistical errors in quadrature. In the lower right panel, we multiply the likelihood function for the WMAPext+2dFGRS data by the likelihood surface for the HST data to determine the joint likelihood surface. The dark areas in these plots are the 68% likelihood regions, and the light areas are the 95% likelihood regions.
Other Images in This Article

Show More
Copyright and Terms & Conditions
© 2003. The American Astronomical Society. All rights reserved. Printed in U.S.A.