Image Details
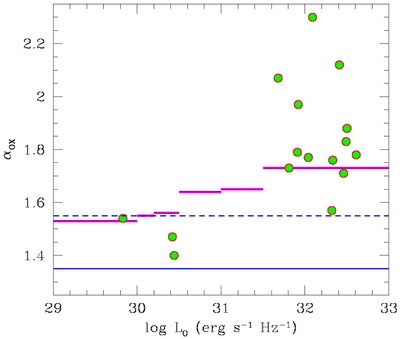
Caption: Fig. 3.
The αOX vs. luminosity compared with (1) the average values found by Yuan et al. (1998) for a sample of ~1000 optically selected quasars (gray lines), (2) the average αOX of PG quasars (dashed line), and (3) the average αOX of X‐ray–selected quasars, according to Elvis et al. 1994 (bottom solid line). The three low‐luminosity objects are those with Chandra fluxes significantly higher than ROSAT upper limits.
Other Images in This Article
Copyright and Terms & Conditions
© 2003. The American Astronomical Society. All rights reserved. Printed in U.S.A.
Copyright ©
2026 Astronomy Image Explorer. All Rights Reserved.