Image Details
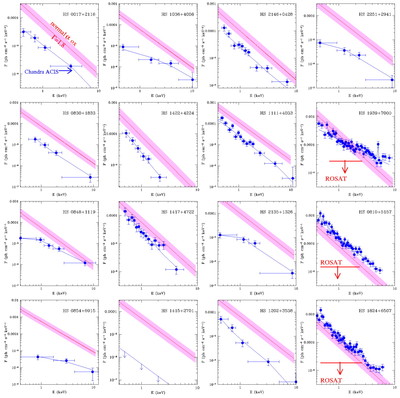
Caption: Fig. 2.
Chandra spectra of the sample of X‐ray–weak quasars. The shaded region represents the X‐ray spectrum expected assuming ﹩\alpha _{\mathrm{OX}\,}=1.55﹩ and ﹩\Gamma =1.8﹩. ROSAT upper limits are shown for the three sources having fluxes significantly higher than those in ROSAT observations.
Other Images in This Article
Copyright and Terms & Conditions
© 2003. The American Astronomical Society. All rights reserved. Printed in U.S.A.
Copyright ©
2026 Astronomy Image Explorer. All Rights Reserved.