Image Details
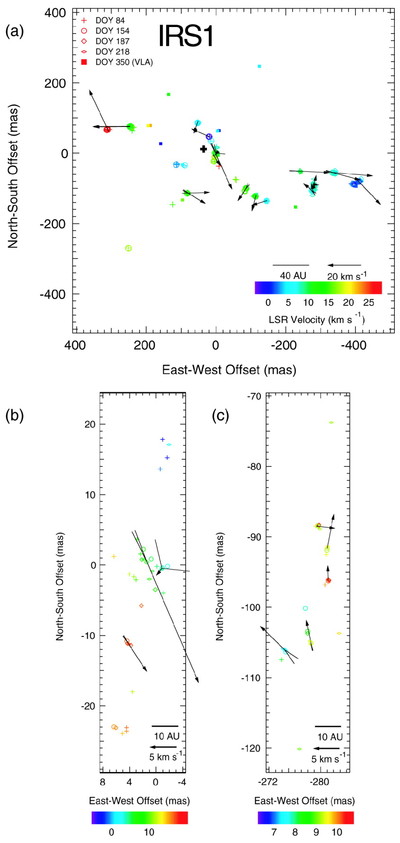
Caption: Fig. 3.
Distribution of water maser emission features in IRS 1. (a) All features, color coded to indicate Doppler velocity. The proper‐motion arrows show the expected change in feature positions over 9 yr. The tails on the proper motions here represent 3 σ uncertainties. The λ1.3 cm continuum peak (black cross) and maser features (colored squares) measured by Torrelles et al. (1998b) with the VLA are shown with 0﹩\farcs﹩01 uncertainty in alignment relative to the VLBA maps. The origin of the map is ﹩\alpha =5^{\mathrm{h}\,}47^{\mathrm{m}\,}04\fs 7774﹩, ﹩\delta =0^{\circ }21^{\prime }42\farcs 803﹩ (J2000.0) with an uncertainty of 0﹩\farcs﹩05 in both directions. The red boxes indicate which fields are shown in the enlargements below. (b) An enlargement that better shows the masers associated with the putative protostellar disk. The arrows correspond to the expected change in feature positions after 1.5 yr. (c) The arc of maser features to the west that does not appear to participate in the high‐speed outflow, despite its apparent proximity.
Other Images in This Article
Copyright and Terms & Conditions
© 2002. The American Astronomical Society. All rights reserved. Printed in U.S.A.