Image Details
Caption: Fig. 2.
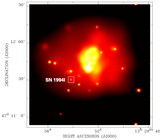
Soft (0.3–2 keV) band X‐ray light curve of SN 1994I. The Chandra detections are marked by filled squares; open squares indicate the early ROSAT HRI detection and 3 σ upper limits. Error bars are ±1 σ statistical errors. Time is given in days after the outburst. The solid line represents a power‐law fit to the detections at days 82, 2271, and 2639. The dashed and dotted lines represent models including an ﹩e^{-\tau }﹩ term (see § 3).
Other Images in This Article

Copyright and Terms & Conditions
© 2002. The American Astronomical Society. All rights reserved. Printed in U.S.A.
Copyright ©
2025 Astronomy Image Explorer. All Rights Reserved.