

Image Details
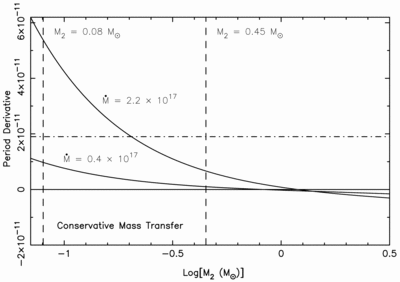
Caption: Fig. 8.
Possible values of the period derivative ﹩\dot{P}_{\mathrm{orb}\,}﹩ as a function of the secondary mass M2. The curved solid lines represent the limits placed on the accretion rate by Gottwald et al. (1986), ﹩\dot{M}_{1}=( 0.4{\mbox{--}} 2.2) \times 10^{17}\mathrm{g}\,\ \mathrm{s}\,^{-1}﹩, in their analysis of X‐ray bursts from EXO 0748−676. We assume a 1.4 M⊙ neutron star with radius 10 km. The vertical dashed lines show the best‐fit secondary mass range derived by Parmar et al. (1986): ﹩M_{2}=0.08{\mbox{--}} 0.45\ M_{\odot }﹩. The horizontal dot‐dashed line represents ﹩\dot{P}_{\mathrm{orb}\,}=1.9\times 10^{-11}﹩.
Other Images in This Article
Copyright and Terms & Conditions
Copyright is not claimed for this article. Printed in U.S.A.

