

Image Details
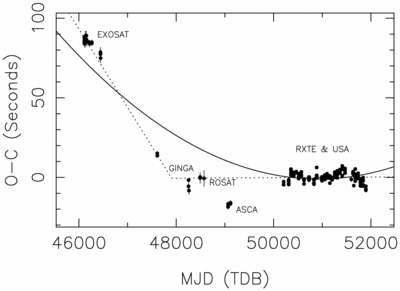
Caption: Fig. 2.
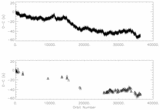
Mideclipse timing residuals for observed eclipses of EXO 0748−676 during 1985–2000, from both the present study and those available in the literature. The residual of the observed mideclipse time from the same constant‐period model as in Fig. 1 is plotted as a function of the barycenter‐corrected observation date. The curved solid line is the constant‐period derivative solution to all the data from Table 4. The dotted line is the broken constant‐period solution from Table 4. No simple linear or quadratic ephemeris fits all the data points.
Other Images in This Article
Copyright and Terms & Conditions
Copyright is not claimed for this article. Printed in U.S.A.

Copyright ©
2026 Astronomy Image Explorer. All Rights Reserved.
