Image Details
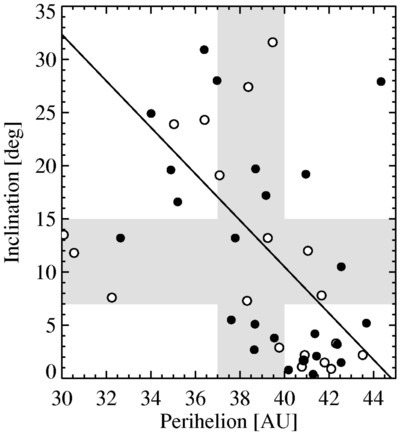
Caption: Fig. 2.
Inclination vs. perihelion for the classical KBOs and scattered KBOs in our sample (filled circles) and all published data (no Plutinos; open circles). For illustrative purposes, a linear least‐squares fit has been plotted for points with perihelion greater than 34 AU (solid line). The gray bars represent the constant q (vertical bar) and constant i (horizontal bar) subsamples detailed in Fig. 3.
Other Images in This Article
Copyright and Terms & Conditions
© 2002. The American Astronomical Society. All rights reserved. Printed in U.S.A.
Copyright ©
2025 Astronomy Image Explorer. All Rights Reserved.