Image Details
Caption: Fig. 1.
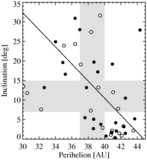
B−R color vs. inclination for the classical KBOs and scattered KBOs in our sample (filled circles) and all published data (no Plutinos; open circles). A linear least‐squares fit has also been plotted for illustrative purposes (solid line; ﹩\mathrm{slope}\,=-0.0196\pm 0.003﹩ mag deg−1, ﹩\mathrm{intercept}\,=1.84\pm 0.5﹩ mag). The trend corresponds to 3.1 σ (our data points) and 4.1 σ (all data points) significance, as estimated by the Spearman rank correlation method.
Other Images in This Article
Copyright and Terms & Conditions
© 2002. The American Astronomical Society. All rights reserved. Printed in U.S.A.
Copyright ©
2025 Astronomy Image Explorer. All Rights Reserved.