Image Details
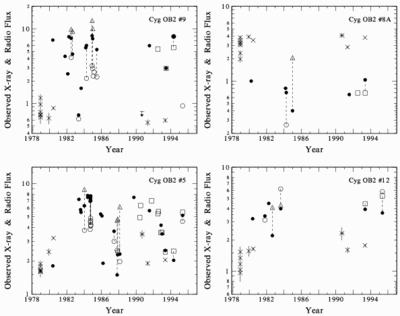
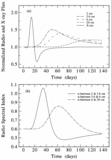
Caption: Fig. 7.
Chronological behavior of the observed radio and X‐ray emission from the selected Cyg OB2 stars covering a time span of 16 yr. The symbols represent the following: X, observed X‐ray flux; filled circle, observed 6 cm radio flux, and the open circles, open squares, and open triangles are, respectively, the extrapolated radio fluxes from the observed radio fluxes at 2, 3.6, and 20 cm (see text for explanation of extrapolated flux). The X‐ray flux units are in ergs cm−2 s−1/10−12, and the radio flux units are in mJy. This illustrates the large variability observed in the radio emission, whereas the X‐ray emission, except for Cyg OB2 No. 5, has remained relatively stable. Cyg OB2 No. 5 displays two events in which the X‐ray flux increased by a factor of ~2. Notice that the strongest X‐ray source (No. 8A) is the weakest radio source, and the weakest X‐ray source (No. 9) is the strongest radio source.
Other Images in This Article
Copyright and Terms & Conditions
©1998. The American Astronomical Society. All rights reserved. Printed in U.S.A.