Image Details
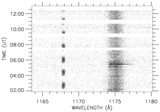
Caption: Fig. 3.
Comparison of profiles of the O VI and C III lines showing the short‐wavelength absorption feature in C III and broadened "bumpy" wings of emission in the C III profile. The velocity scale has an arbitrary offset for each line and was simply co‐aligned in this figure.
Other Images in This Article

Copyright and Terms & Conditions
© 2000. The American Astronomical Society. All rights reserved. Printed in U.S.A.
Copyright ©
2025 Astronomy Image Explorer. All Rights Reserved.