Image Details
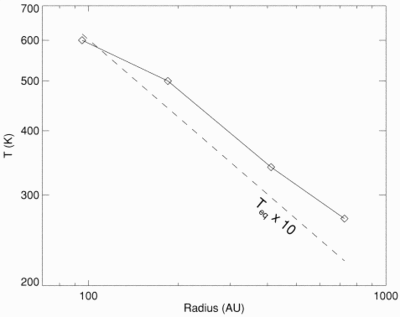
Caption: Fig. 4.
Color temperatures of the blackbody curves used to construct the continuum‐subtracted spectra in Fig. 3. The dashed line represents 10 times the blackbody equilibrium temperature for a ﹩L=22\,L_{\odot }﹩ star.
Other Images in This Article
Copyright and Terms & Conditions
© 1998. The American Astronomical Society. All rights reserved. Printed in U.S.A.
Copyright ©
2025 Astronomy Image Explorer. All Rights Reserved.