Image Details
Caption: Fig. 2.
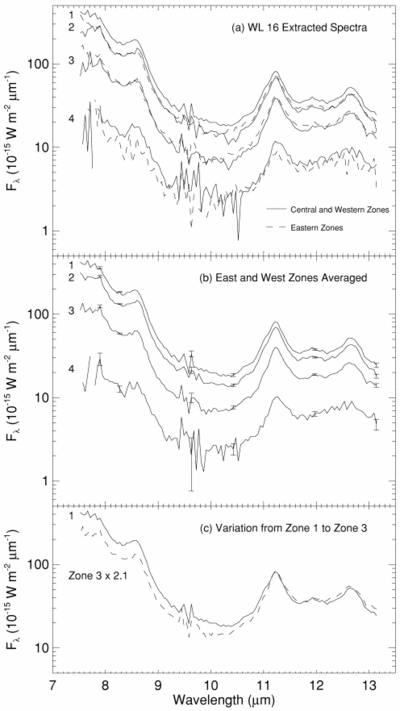
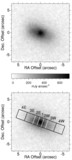
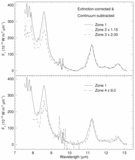
(a) Low‐resolution spectra representing the seven zones outlined in Fig. 1. Fluxes from the larger outer zones are normalized to the area of the ﹩1^{\prime \prime }\times 2^{\prime \prime }﹩ zone at the center. Emission features are seen at 8.6, 11.3, and 12.7 μm, and the rise below 9 μm is the wing of the 7.7 μm feature. (b) Spectra with east and west zones averaged. (c) Zone 1 compared to zone 3 multiplied by 2.1 to equalize the spectra at the peak of the 11.3 μm feature. Note the overall difference in slope of the emission at the two positions.
Other Images in This Article
Copyright and Terms & Conditions
© 1998. The American Astronomical Society. All rights reserved. Printed in U.S.A.
Copyright ©
2025 Astronomy Image Explorer. All Rights Reserved.