Image Details
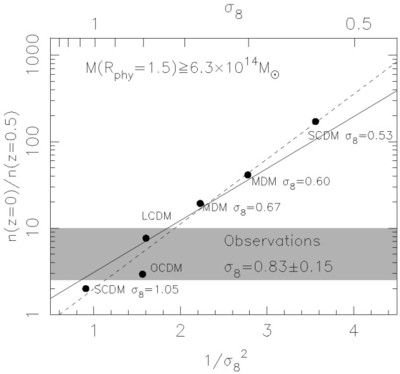
Caption: Fig. 4.
Cluster abundance ratio ﹩n( z=0) / n( z=0.5) ﹩ vs. σ8 from N‐body simulations (dots), and Press‐Schechter approximation (solid line), for ﹩M_{1.5}\geq 6.3\times 10^{14}﹩ h−1 M⊙ clusters. The observed abundance ratio (§ 3) is shown by the shaded region. The solid line is the direct P‐S relation (see eq. [1]) for the given M1.5 mass threshold, for ﹩\Lambda =0﹩ and mean of all Ω's; the dashed line represents the best‐fit relation from the simulations.
Other Images in This Article
Copyright and Terms & Conditions
© 1997. The American Astronomical Society. All rights reserved. Printed in U.S.A.
Copyright ©
2025 Astronomy Image Explorer. All Rights Reserved.