Image Details
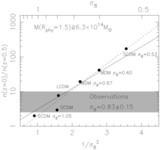
Caption: Fig. 2.
Dependence of the evolution rate ﹩\mathstrut{\cal E} ( z) ﹩ on the slope of the power spectrum n and on the cluster mass threshold M. Solid, dashed, and dotted lines correspond to ﹩\Omega =1﹩, 0.5, and 0.3 flat models, respectively.
Other Images in This Article
Copyright and Terms & Conditions
© 1997. The American Astronomical Society. All rights reserved. Printed in U.S.A.
Copyright ©
2025 Astronomy Image Explorer. All Rights Reserved.