Image Details
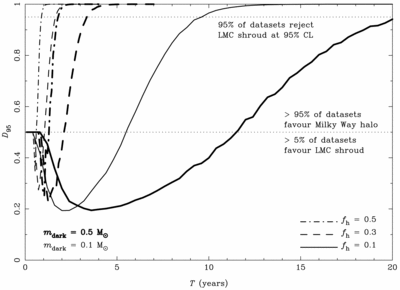
Caption: Fig. 3.
Discriminatory power of our idealized LMC microlensing experiment as a function of its lifetime T. The input (true) lens model comprises an LMC disk and bar, together with a Milky Way halo comprising MACHOs of mass ﹩m_{\mathrm{dark}\,}=0.1\,M_{\odot }﹩ (thin lines) and ﹩0.5\,M_{\odot }﹩ (thick lines), and fractional contribution ﹩f_{h}=0.1﹩ (solid lines), 0.3 (dashed lines), and 0.5 (dot‐dashed lines). The comparison model consists of the same LMC disk and bar, but in place of a Milky Way halo is a diffuse LMC shroud comprising lenses of the same mass ﹩m_{\mathrm{dark}\,}﹩ but with a mass factor ﹩f_{s}=1﹩. The discrimination measure D represents the confidence with which the data favor the input model (halo) over the comparison model (shroud) after time T, and ﹩D_{95}﹩ is its 95% lower limit value derived from a large ensemble of data sets. Lines dipping below the dotted line at ﹩D_{95}=0.5﹩ indicate configurations in which more than 5% of simulated data sets misleadingly implicate the shroud model over the halo model. Lines rising above the ﹩D_{95}=0.95﹩ dotted line indicate that in 95% of simulations sufficient data have been accumulated to reject the shroud model with greater than 95% confidence.
Other Images in This Article

Copyright and Terms & Conditions
© 2000. The American Astronomical Society. All rights reserved. Printed in U.S.A.