Image Details

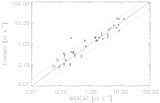
Caption: Fig. 1.
Scatter plot of count rates observed at different epochs: RASSBSC vs. Einstein. The Einstein count rates have been uniformly multiplied by a factor of 3.7 as derived by a straight‐line fit to the Einstein‐RASSBSC data set. The size of the 1 σ errors on the rates is indicated by the horizontal and vertical lines at each point. The solid inclined line represents the line of equality and the dotted lines flanking it represent variations of factors of 2.
Other Images in This Article
Copyright and Terms & Conditions
© 1999. The American Astronomical Society. All rights reserved. Printed in U.S.A.
Copyright ©
2025 Astronomy Image Explorer. All Rights Reserved.