Image Details
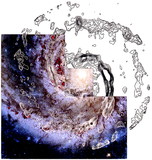
Caption: Fig. 8.
Inner region of the residual velocity map after a rotation curve has been removed. Solid lines indicate redshifted velocities with respect to the model [﹩v/v_{\mathrm{max}\,}=1-e^{-\mathrm{ln}\,\left(100\, R/R_{\mathrm{max}\,}\right)}﹩]. Contour spacing is 10 km s−1. Gray scale goes from 10 to 40 km s−1 residual velocities. Regions of blueshifted deviations from the model are indicated as follows: vertical lines indicate velocities ≲−30 km s−1, cross‐hatching indicates −30 to −20 km s−1, and horizontal lines indicate −20 to −10 km s−1. White indicates regions of no deviation from circular velocities. The greatest deviations from circular rotation are found in two ﹩10^{\prime \prime }\times 20^{\prime \prime }﹩ regions west (redshifted) and east (blueshifted) of the center; the small spurs (or rather fractions of spurs) protruding from the western arm also show deviations from circular velocities by up to 40 km s−1. There is also a redshifted region just north of the blueshifted region to the east. The nuclear disk is redshifted with respect to the systemic velocity.
Other Images in This Article
Show More
Copyright and Terms & Conditions
© 1999. The American Astronomical Society. All rights reserved. Printed in U.S.A.