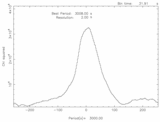
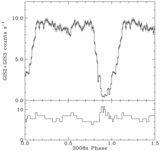
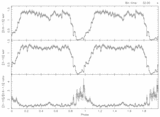
Image Details
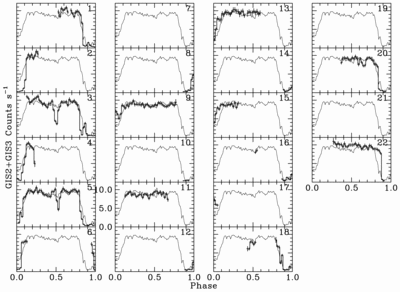
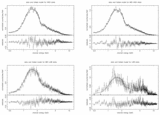
Caption: Fig. 3.
ASCA observation covered parts of the 22 cycles of the 3008 s period. Each panel covers one individual cycle; solid line is the average (identical to Fig. 2); the histogram with error bars is the summed count rate from GIS2+GIS3. Note that the secondary dips are limited to the first ~5 cycles of this observation.
Other Images in This Article
Copyright and Terms & Conditions
© 1999. The American Astronomical Society. All rights reserved. Printed in U.S.A.
Copyright ©
2025 Astronomy Image Explorer. All Rights Reserved.