Image Details
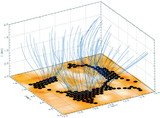
Caption: Fig. 5.
Divergence of granulation flow velocity. (a) As computed for frame 40 of the La Palma data using the two‐dimensional flow model presented in § 4; (b) as derived from three‐dimensional simulations of solar granulation by Stein & Nordlund (1994) for a depth of 40 km. The Stein & Nordlund results are displayed on the same spatial scale and resolution as the La Palma data. Bright regions indicate diverging flow (granules), dark regions indicate converging flow (lanes). Note that the intergranular lanes are very narrow (~100 km) in both simulations.
Other Images in This Article
Copyright and Terms & Conditions
© 1998. The American Astronomical Society. All rights reserved. Printed in U.S.A.
Copyright ©
2026 Astronomy Image Explorer. All Rights Reserved.