Image Details
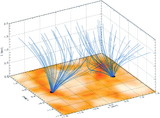
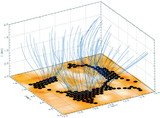
Caption: Fig. 10.
(a) Horizontal velocity at a height of 1500 km in the chromosphere, as predicted from the potential‐field model for the region shown in Fig. 9. The longest arrows in this plot correspond to 5 km s−1, and the bold arrows show the direction of the field in regions where the horizontal velocity exceeds 5 km s−1. (b) Separatrices between different flux tubes.
Other Images in This Article
Copyright and Terms & Conditions
© 1998. The American Astronomical Society. All rights reserved. Printed in U.S.A.
Copyright ©
2026 Astronomy Image Explorer. All Rights Reserved.