Image Details
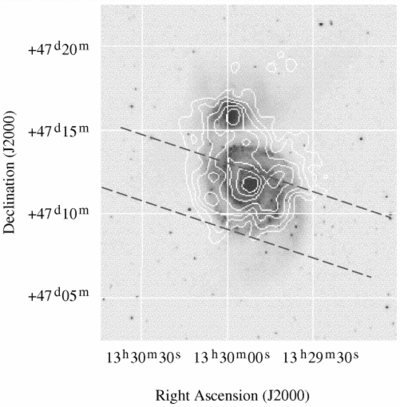
Caption: Fig. 1.
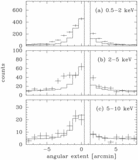
Contour map of M51 and NGC 5195 taken with SIS detectors (SIS0 + SIS1) superposed on optical image. Background is not subtracted. The contour levels are logarithmically spaced. The region between dashed lines is used to make a projected brightness profile presented in Fig. 2.
Other Images in This Article
Copyright and Terms & Conditions
© 1998. The American Astronomical Society. All rights reserved. Printed in U.S.A.
Copyright ©
2025 Astronomy Image Explorer. All Rights Reserved.