Image Details
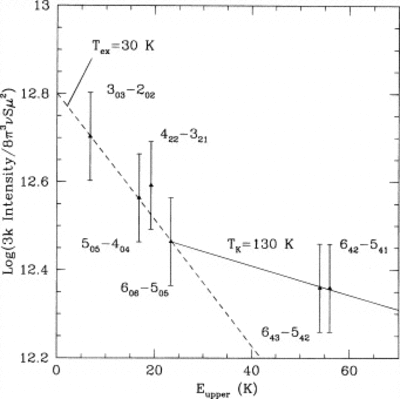
Caption: Fig. 4.
Plot of log (3k ∫ TRdV/8π3νSμ2) versus energy of the upper state in the transition (Eupper) for the transitions of ground (vibrational) state SiC2 in Fig. 2. The data indicate Trot1 = 30 K and Trot2 = 130 K for the excitation temperatures within and across K‐ladders, respectively. The column density of SiC2 is N(ν3 = 0) ![]() 2.2 × 1015 cm−2. If, on the other hand, we assume Trot1 = 15 K and Trot2 = 145 K (see text), we obtain N(ν3 = 0)
2.2 × 1015 cm−2. If, on the other hand, we assume Trot1 = 15 K and Trot2 = 145 K (see text), we obtain N(ν3 = 0) ![]() 1.1 × 1015 cm−2.
1.1 × 1015 cm−2.
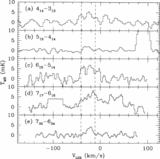
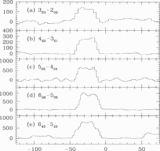
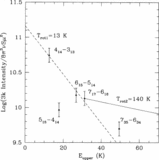
Other Images in This Article
Copyright and Terms & Conditions
© 1997. The American Astronomical Society. All rights reserved. Printed in U.S.A.
Copyright ©
2025 Astronomy Image Explorer. All Rights Reserved.