Image Details
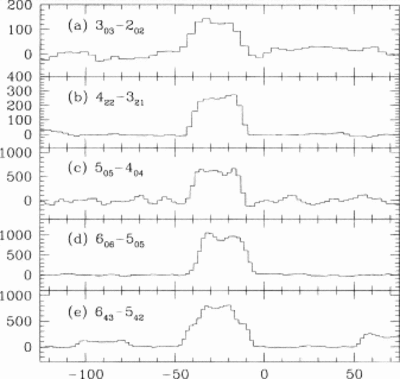
Caption: Fig. 2.
Spectra of ground (vibrational) state SiC2. The transitions in this plot are: (a) 303–202; (b) 422–321; (c) 505–404; (d) 606–505; and (e) 643–542 and 642–541 (blended). The lines are centered at VLSR = −26 km s−1 and 30 km s−1 wide (full width at zero intensity).
Other Images in This Article
Copyright and Terms & Conditions
© 1997. The American Astronomical Society. All rights reserved. Printed in U.S.A.
Copyright ©
2025 Astronomy Image Explorer. All Rights Reserved.