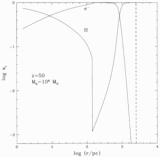
Image Details
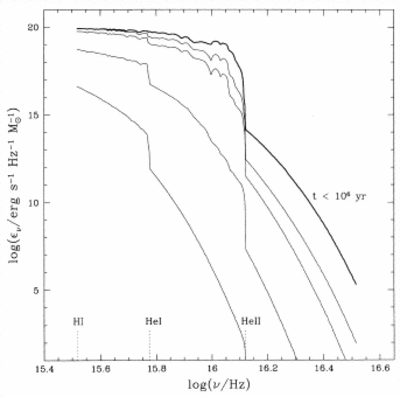
Caption: Fig. 3.
Composite emissivity per solar mass for a star cluster with a Scalo IMF. Each star is assumed to evolve on the H‐R diagram according to the theoretical evolutionary tracks of Schaller et al. (1992) and to emit radiation according to the spectral atlas of Kurucz (1993). The thick line shows the steady emissivity when all the stars are still on the main sequence (≲106 yr after the starburst). The four solid lines show the emissivity at four subsequent times (from top to bottom): t = 3, 4, 10, and 30 million yr after the starburst. Frequencies corresponding to the ionizations of hydrogen and helium are marked—note the sharp drop of the emissivity at the He II edge.
Other Images in This Article
Show More
Copyright and Terms & Conditions
© 1997. The American Astronomical Society. All rights reserved. Printed in U.S.A.