

Image Details
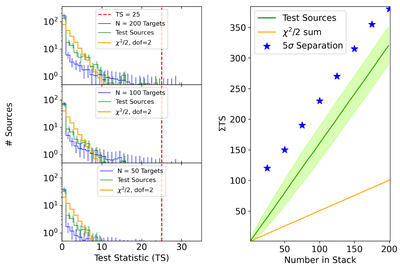
Caption: Figure 1.
Left: a subset of the tested synthesized target distributions (N = 50, 100, 200) plotted with the CF (green) and theoretical null χ2 distributions (orange). Right: the cumulative TS values of the CFs and the theoretical null. The blue stars represent the cumulative TS for the synthesized target distribution required for a 5σ separation from the CFs.
Copyright and Terms & Conditions
© 2026. The Author(s). Published by the American Astronomical Society.

Copyright ©
2026 Astronomy Image Explorer. All Rights Reserved.
