

Image Details
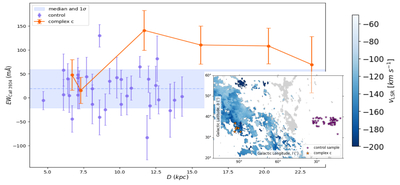
Caption: Figure 1.
The main plot shows the measured equivalent width versus distance of stars in the target sample (orange) and the control sample (blue). The statistics (median and 1σ) of the control sample are shaded in blue. The inset plot shows the location of the two selected samples overlaid on a map of high-velocity H I from T. Westmeier (2018). H I associated with Complex C was masked based on coordinates (l = [39∘, 147∘], b = [18∘, 61∘]) (H. van Woerden et al. 2004) and velocity (vLSR < −91 km s−1), and is colored blue; other H I gas not associated with Complex C is colored gray.
Copyright and Terms & Conditions
© 2026. The Author(s). Published by the American Astronomical Society.

Copyright ©
2026 Astronomy Image Explorer. All Rights Reserved.
