Image Details
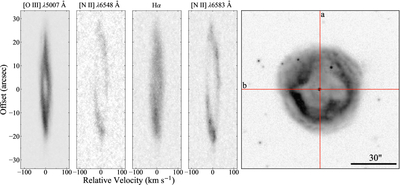
Caption: Figure 1.
(Left) Position–Velocity maps for the [O III] λ5007 Å, [N II] λ6548 Å, Hα and [N II] λ6583 Å lines respectively. (Right) IC 972 in the light of Hα + [N II] λ6583 Å (R. L. M. Corradi et al. 2003) with the vertical and horizontal red lines showing the slit positions observed. Since the spectra appear almost identical, here we only present the PV maps for the slit a. For the image, north is up and east is to the left, while in the Position–Velocity maps, north is up and south is down.
Copyright and Terms & Conditions
© 2026. The Author(s). Published by the American Astronomical Society.
Copyright ©
2026 Astronomy Image Explorer. All Rights Reserved.