Image Details
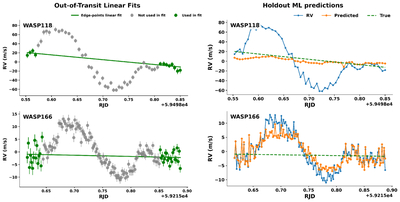
Caption: Figure 1.
Left: RM time series for WASP-118 and WASP-166 after subtraction of the mean RV. Green points indicate the out-of-transit measurements used to estimate the reference RV trend (solid line), while gray points are affected by the RM anomaly and are excluded from the fit. Right: leave-one-star-out predictions for the same systems. The panels compare the observed RVs (blue), the ML-predicted reference RV trend (orange), and the reference RV trend derived from the out-of-transit fit (green).
Copyright and Terms & Conditions
© 2026. The Author(s). Published by the American Astronomical Society.
Copyright ©
2026 Astronomy Image Explorer. All Rights Reserved.