

Image Details
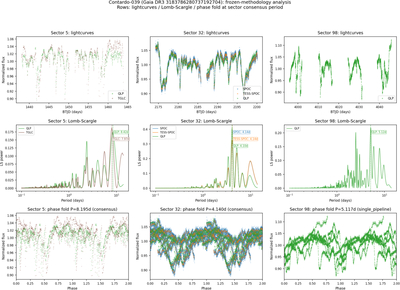
Caption: Figure 1.
Per-sector TESS multi-pipeline analysis of Gaia DR3 3183786280737192704 (TIC 43488669). Columns: sectors 5, 32, and 98. Top row: lightcurves with available pipelines overplotted (S5: QLP, TGLC; S32: SPOC, TESS-SPOC, QLP; S98: QLP only). Middle row: Lomb–Scargle periodograms with dominant period per pipeline marked. Bottom row: phase folds at the sector consensus period. Sector 32 shows cross-pipeline agreement at P = 4.14 days. Sector 5’s recovered 8.2 days is the 2× alias of the same signal. Sector 98’s 5.12 days is single-pipeline.
Copyright and Terms & Conditions
© 2026. The Author(s). Published by the American Astronomical Society.

Copyright ©
2026 Astronomy Image Explorer. All Rights Reserved.
