Image Details
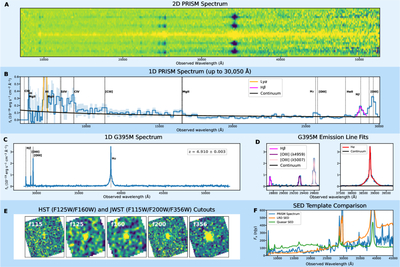
Caption: Figure 1.
Panel (A): 2D PRISM spectrum. Panel (B): 1D PRISM spectrum (truncated) with emission lines, power-law continuum, and Lyα and Hβ fitting. Panel (C): 1D G395M spectrum showing Hβ, [O III], and Hα. Panel (D): Left: G395M spectrum showing Hβ and [O III] Gaussian fits. Right: G395M spectrum showing Hα fit components. Panel (E): HST/WFC3 (F125W/F160W, GO 16187) and JWST/NIRCam (F115W/F200W/F365W, GO 2028) imaging. Panel (F): PRISM spectrum showing Fν with LRD (orange) and quasar (green) template SEDs.
Copyright and Terms & Conditions
© 2026. The Author(s). Published by the American Astronomical Society.
Copyright ©
2026 Astronomy Image Explorer. All Rights Reserved.