Image Details
Caption: Figure 1.
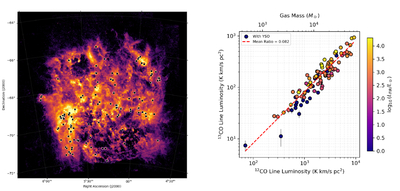
(left) Herschel SPIRE 500 μm dust continuum map of the LMC displayed on a logarithmic stretch. Circles indicate the positions of the ALMA fields. (right) Correlation between 12CO and 13CO for 100 GMCs in the LMC. The points are color-coded by the far-infrared luminosity ﹩(\mathrm{log}{L}_{\,\rm{FIR}\,})﹩ from YSOs inside the molecular clouds. The red dashed line represents the ensemble mean ratio (R13 = 0.082).
(The data used to create this figure are available in the online article.)
(The data used to create this figure are available.)
Copyright and Terms & Conditions
© 2026. The Author(s). Published by the American Astronomical Society.
Copyright ©
2026 Astronomy Image Explorer. All Rights Reserved.