Image Details
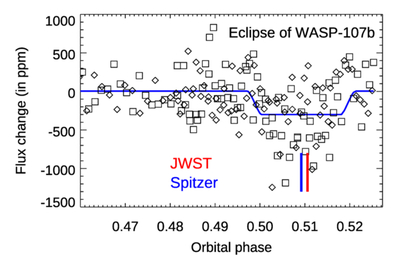
Caption: Figure 1.
Spitzer photometry for four stacked eclipses of WASP-107b (D. Deming et al. 2023). The 3.6 μm band is plotted using squares, and the 4.5 μm band using diamonds. These are binned data, with 50 points spanning each eclipse. The blue curve is the best-fitting Spitzer eclipse, and the vertical lines indicate the best-fit central phases from Spitzer, and calculated for a single JWST eclipse based on the orbital parameters of Y. Wu et al. (2026).
Copyright and Terms & Conditions
© 2026. The Author(s). Published by the American Astronomical Society.
Copyright ©
2026 Astronomy Image Explorer. All Rights Reserved.