

Image Details
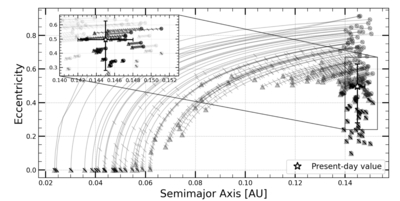
Caption: Figure 8.
Evolution of the semimajor axis and eccentricity for the super-Earth case, showing only 100 cases to avoid cluttering the figure. The filled circle denotes the initial semimajor axis and eccentricity, while the triangle denotes their final values. Tick marks along the trajectory indicate 500 Myr intervals during the tidal evolution. The white star represents the present-day e and a of TOI-2257 b, with their associated uncertainties. Tracks terminating within the present-day e and a uncertainty ranges are darkened. Note that there are no tick marks obscured by the smaller upper-left panel.
Other Images in This Article
Copyright and Terms & Conditions
© 2026. The Author(s). Published by the American Astronomical Society.

Copyright ©
2026 Astronomy Image Explorer. All Rights Reserved.
