

Image Details
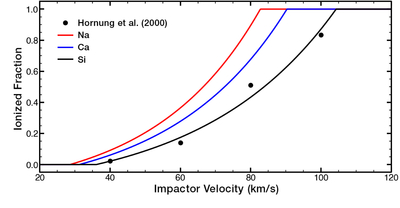
Caption: Figure 2.
If versus v for Si (black), Na (red), and Ca (blue). Si is obtained from a fit to the hydrocode results of K. Hornung et al. (2000), shown by the black circles, with the Na and Ca lines scaled by ionization potential as described in the main text.
Other Images in This Article
Copyright and Terms & Conditions
© 2026. The Author(s). Published by the American Astronomical Society.

Copyright ©
2026 Astronomy Image Explorer. All Rights Reserved.
