

Image Details
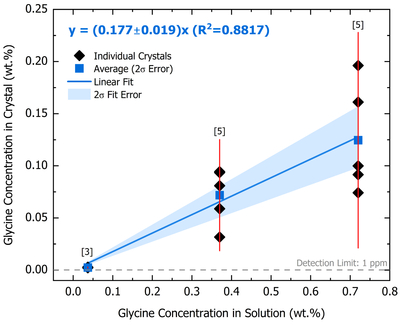
Caption: Figure 4.
Glycine concentration in NaCl crystals as a function of glycine concentration in the parent brine, both expressed in weight percent (wt%). Black diamonds represent individual crystal measurements; errors on individual measurements are smaller than the symbol size. Blue squares represent the mean of all measurements at each concentration with 2σ error bars (red). Bracketed values indicate the number of samples measured at each concentration. The blue line is the linear regression forced through the origin, with the shaded region representing the 2σ fit uncertainty. The regression yields a slope of 0.177 ± 0.019 (R2 = 0.88).
Other Images in This Article
Copyright and Terms & Conditions
© 2026. The Author(s). Published by the American Astronomical Society.

