

Image Details
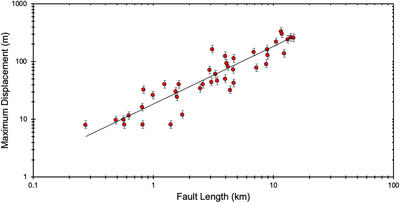
Caption: Figure 4.
Log–log plot of maximum fault displacement as a function of fault length for 42 lobate scarps (red circles). The ratio γ of the population of thrust faults was obtained by a linear fit to the D–L data with the intercept set to the origin. A value of γ ≅ 1.84 × 10² is obtained using estimates of Dmax based on fault plane dips θ = 30°. The error bars indicate the range in displacement for θ = 25° and 35°.
Other Images in This Article
Copyright and Terms & Conditions
© 2026. The Author(s). Published by the American Astronomical Society.

Copyright ©
2026 Astronomy Image Explorer. All Rights Reserved.
