

Image Details
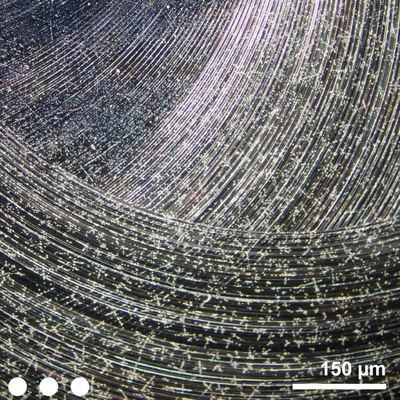
Caption: Figure 2.
Optical image as an example of the distribution of the Au NPs (bright spherical dots) at a high concentration in a sample cavity. The laser spot size and distance between consecutive measurement positions are highlighted with the three white circles shown at the bottom left.
Other Images in This Article
Copyright and Terms & Conditions
© 2026. The Author(s). Published by the American Astronomical Society.

Copyright ©
2026 Astronomy Image Explorer. All Rights Reserved.
