

Image Details
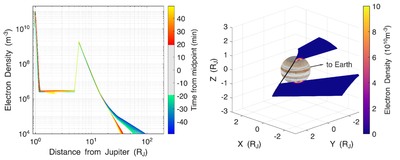
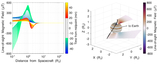
Caption: Figure 6.
Electron density profiles for Juno PJ-63 occultation. The left panel shows the modeled electron density along the ray paths, displayed with the same color scale used in Figure 5, indicating time from the occultation midpoint in minutes, with negative values corresponding to ingress (blue) and positive values to egress (yellow), illustrating the transition from the ionosphere to the magnetosphere. The right panel presents a three-dimensional view of the modeled electron density near Jupiter, highlighting the thin ionospheric layer, with the Juno trajectory shown as a black line through the planet and the direction to Earth indicated by the labeled arrow.
Other Images in This Article
Copyright and Terms & Conditions
© 2026. The Author(s). Published by the American Astronomical Society.

