

Image Details
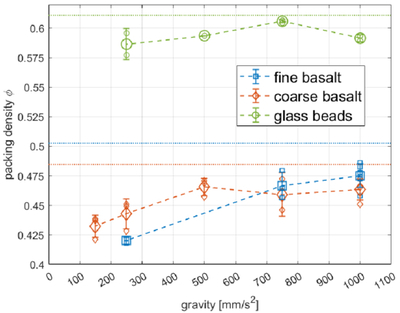
Caption: Figure 9.
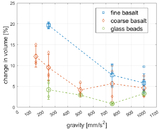
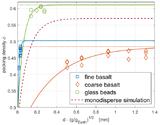
Packing density for different gravities. Symbols with error bars mark the averages for 150, 250, 500, 750, and 1000 mm s−2, and the error bars are the standard deviations of these averages. The horizontal lines show values in 1 g.
Other Images in This Article
Copyright and Terms & Conditions
© 2026. The Author(s). Published by the American Astronomical Society.

Copyright ©
2026 Astronomy Image Explorer. All Rights Reserved.
