

Image Details
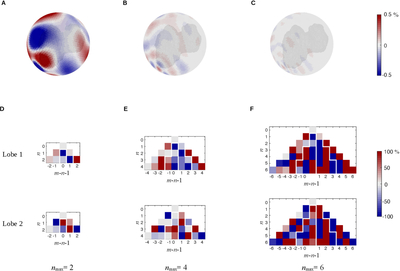
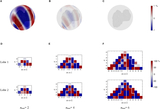
Caption: Figure 4.
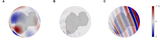
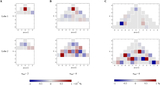
Residual and estimation error of the boundary value solution using degree-10 global SH model. Residuals are shown in panels (A)–(C) for EH resolutions up to degrees 2, 4, and 6, respectively. The coefficient errors are in (D)–(F) for the respective resolutions, where results for Lobe 1 are in the upper row. The same color scale between −1 and 1% is used for residuals in all cases to accentuate the comparison; larger values occurring only in A are over-saturated. The range between −100 and 100% is accentuated for the coefficient errors.
Other Images in This Article
Show More
Copyright and Terms & Conditions
© 2026. The Author(s). Published by the American Astronomical Society.

Copyright ©
2026 Astronomy Image Explorer. All Rights Reserved.
