

Image Details
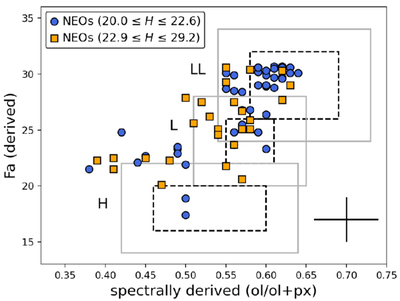
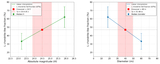
Caption: Figure 4.
Molar content of fayalite (Fa) vs. ol/(ol+px) ratio derived for the two-subgroup analysis. Black dashed boxes represent the range of measured values for each ordinary chondrite subtype. Gray solid boxes represent the uncertainties associated with the spectrally derived values (J. A. Sanchez et al. 2020). The error bars correspond to the uncertainties derived by J. A. Sanchez et al. (2020), 2.0 mol% for Fa and 0.04 for the ol/(ol+px) ratio. Figure adapted from T. L. Dunn et al. (2010).
Other Images in This Article
Show More
Copyright and Terms & Conditions
© 2026. The Author(s). Published by the American Astronomical Society.

Copyright ©
2026 Astronomy Image Explorer. All Rights Reserved.
